The only financial measure taxpayers care about
Consider the following graph of total revenues for a jurisdiction (this is my own electoral area in rural British Columbia):
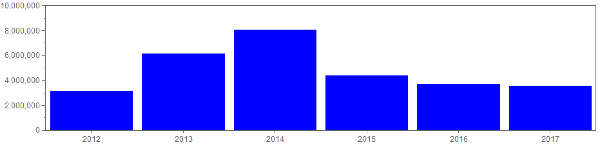
The swings from $3M to $8M per year indicate significant volatility and unpredictability. And since revenues match expenses (at least the day the budget is passed), some observers might conclude that expenses in this jurisdiction are volatile and unpredictable. People with a private sector background typically regard large swings in revenues and expenses as undesirable. The swings suggests a lack of control and perhaps even mismanagement.
However, in local government, not all revenue is treated equal. In particular, grants, transfers from reserves, and loan proceeds often lead to significant distortions because:
- These inflows of cash are often large relative to the size of the local government's budget (road and water systems aren't cheap).
- They have little immediate impact on taxpayers.
This second point is only obviously correct for grants, which fall from the sky as free money. But transfers from reserves and borrowing are simply techniques for changing the timing of cash flows: reserves are built up over a long period whereas loans and bonds are paid back over a long period. The true taxpayer impact of saving and borrowing is spread over multiple years even though the expenditures of reserves or loan proceeds can occur over a short period when, for example, we pay a contractor to upgrade a water system. Thus, when we say "taxpayer funded revenue", we only include revenue that comes out of taxpayers' pockets in the current year.
This importance of this distinction is made in a paper by the C.D. Howe institute: Capital spending and the revenue to pay for it cancel each other out. So what matters is not these offsetting spikes but the longer term taxpayer-funded costs of building reserves or paying back debt. We see this accrual approach to cash flows in our financial statements. However, if you are like me, you spend more time with your nose in the budget than the financial statements. And budgets rarely make the distinction between ordinary and extraordinary items. The graph above is taken right from my budget.
An alternative measure: Taxpayer funded revenue
The same data in the graph above can be split according to whether the revenue in question comes from the taxpayer's pockets. Such taxpayer funded revenues (shown as the blue portion of each bar) include property taxes of all types and fees for products and services the government sells to its taxpayers (such as water, recreation user fees, and so on).

This graph allows us to distinguish between the frothy flows (the orange segments resulting from the water systems we constructed in 2013-14) and the ongoing revenue we required from taxpayers every year to cover operations, build reserves, and pay back debt. I think this is more useful. You see that taxpayer costs (adjusted for inflation, of course) are reasonably constant from 2012-17. And this is with the debt servicing costs that started in 2015 to pay back the influxes of borrowed money in the 2013-14 budgets.
Classifying revenues and expenses
A similar distinction can be made on the expense side of a local government's profit and loss (P&L) statement. Some expenses, such as wages and operating costs, are relatively predictable and inevitable. Other expenses, such as capital projects, are more discretionary and are paid for over many years using savings or debt. This distinction leads to a handy 2x2 way of thinking about revenues and expenses:

Extraordinary and Ordinary components of the P&L
Each cell in the 2x2 is important. However, the revenues and expenses in the "Ordinary" column are most useful for examining trends and benchmarking against peer organizations.
Any thoughts or experiences with this? If so, please comment below.