Having it Both Ways: A Response to “From A to F: Grading the Fiscal Transparency of Canada’s Cities, 2019”
Executive Summary
In its annual ranking of municipal budgets in Canada, the C.D. Howe Institute identifies several shortcomings of the prevailing budgeting practices in local government (Robson and Omran, 2019). The underlying technical issue is the inconsistency between cash-based budgets and accrual-based financial statements. The solution advocated by the authors is to construct municipal budgets on the same accrual basis as financial statements. However, this remedy ignores the factors that have made cash-based budgets so durable in local government in the first place, specifically: understandability and the practical requirement to manage cash over the year. In this paper, I argue that it is possible to address the shortcomings of cash budgets without sacrificing their simplicity and practical usefulness. Interactive visual presentations of financial information allow decision-makers and interested parties to switch between different perspectives depending on the questions they are trying to answer. I discuss these possibilities below within the context the problems identified by Robson and Omran using real-world data from local governments.
Introduction
The C.D. Howe institute recently released its annual report card for municipal budgets (Robson & Omran, 2019). Such rankings invariably contain an element of arbitrariness—for example: which attributes determine quality, how the attributes are weighted relative to each other, how the properties of the budget are mapped to scores, and so on. However, the authors frame their analysis within a broader and more important critique of prevailing budgeting practices in local government. Three specific problems stand out:
- Missing capital: Many local governments separate operating budgets from capital budgets.
- Frothy cashflows: Budgets are typically cash-based, which means they overstate the immediate impact of large, long-lived capital expenditures.
- Total taxpayer impact: Many municipalities focus on property taxes rather than the entire taxpayer footprint, which includes fees, penalties, and anything that directly imposes costs on taxpayers.
The underlying technical issue identified in the C. D. Howe report is the inconsistency between cash-based budgets and accrual-based financial statements. Local governments—like most households—have traditionally focused on balancing cash revenues with cash expenses. However, the Public Sector Accounting Board (PSAB) prefers accrual accounting because it better matches the costs and benefits of long-lived assets over time.
All municipalities in Canada must publish audited accrual-based financial statements. But financial statements suffer from several shortcomings as a decision-making tool. First, the audited statements arrive after the close of the fiscal year and typically after the adoption of the budget for the subsequent year. Unlike the private sector, much of the revenue generated by local governments is determined by a once-annual decision on taxation. Thus, a problem noted in the financial statements for year i is not rectifiable until the budget for year i + 2. This lag is unlikely to lead to informed and responsive decision-making. Second, financial statements are difficult to understand. Few non-accountants seem able to navigate the interactions of the three financial statements and their many notes. Having strong representation from small business among elected officials does not necessarily solve this problem since studies show many small business owners also struggle with financial statements (e.g., Carraher & Van Auken, 2013). Not surprisingly, the presentation of the audited financial statements to the elected council or board at the end of the year is often little more than an awkward ritual.
The solution advocated by Robson and Omran is to construct municipal budgets (or at least construct supporting materials for budgets) on the same accrual basis as financial statements. However, this remedy ignores the factors that have made cash-based budgets so durable in local government in the first place, specifically: understandability and the practical requirement to manage cash over the year. Indeed, Germany continues to allow public sector entities to use cash accounting because “German public sector entities set great store on achieving—and being able to publicly report on—a balanced cash-based budget.” (Eulner & Waldbauer, 2018)
In my view, it is possible to address the shortcomings of cash budgets without sacrificing their simplicity and practical usefulness—though perhaps not with a conventional paper-based tabular budget. Interactive visual presentations of financial information allow decision makers and other interested parties to switch between different perspectives depending on the questions they are trying to answer. I discuss these possibilities below within the context the problems identified by Robson and Omran using real-world examples from local governments.
Problems with Existing Local Government Budgets
Missing Capital
Budgets contain fiscal plans for the upcoming year. They are the principal opportunity for elected representatives, the public, and the media to learn about, and provide input on, municipal priorities. In most cases, municipalities present both an operating budget that is subject to a provincial requirement for annual balance and a capital budget for infrastructure and other long-lived assets. (Robson & Omran, 2019, p. 3)
Separate budgets for operations and capital prevent readers from confusing steady-state operating items—such as wages and materials—with the frothy and largely discretionary cashflows associated with the acquisition and funding of large, long-lived assets. The obvious downside of separate operating and capital budgets is that they make it more difficult for readers to piece together a coherent picture of each government service. In the worst case, the capital budget, and all its strategic implications, is lost in the conventional focus on the operating budget and its impact on property taxes.
An alternative approach is to combine both capital and operating cash flows for each government cost center in a single budget but provide visual cues to help readers differentiate between the steady-state elements of the operations budget and the transient cashflows associated with capital projects. To illustrate, consider Figure 1(a), which shows the expense side of the 2020 budget for a municipality’s “Roads” cost center. It is clear at a glance that the municipality plans to spend significantly more on capital than operations in the coming year. However, the different colors serve as visual cues, allowing the reader to differentiate between steady state operating expenses and transient expenses such as capital spending and internal transfers. The interactivity of the medium allows readers to go further and supress (literally cross-out) the transient expenses, as shown in Figure 1(b).
|
|
|
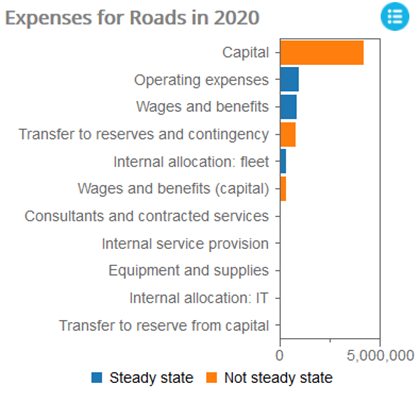
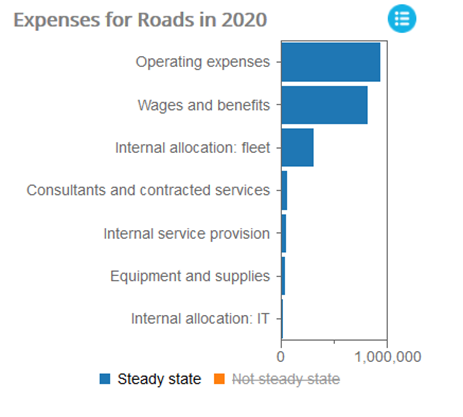
Figure 1: A graphical representation of expenses for a “Roads” cost center. (a) All expenses and (b) The same information with transient (“Not steady state”) expenses supressed.
In principle, this type of interactive visual presentation can achieve the same benefit as full accrual accounting: providing the reader of the budget with a more realistic understanding of the long-term steady state consequences of spending decisions. However, whether this benefit is fully achieved in practice is more a matter of policy than presentation. These policy choices are discussed in the next section.
Frothy Cashflows
As noted above, one rationale for separating capital and operating budgets is to reduce the risk that decision-makers and other stakeholders focus excessively on transient cashflows from large capital projects. Robson and Omran advocate a more sophisticated alternative to separate operating and capital budgets: amortize each capital project over its useful life. In practice, this means splitting the total cost of the project into its equivalent annual cost and showing only the amortized amount in the budget. This is analogous to the non-cash depreciation expense shown in the accrual-based income statement. It captures the intuition that, since capital assets provide benefits over many years, their costs should be spread over many years.
In identifying objections to accrual-based budgets, Robson and Omran acknowledge one potential psychological side-effect:
Another argument against [Public Sector Accounting Standards]-consistent budgets relates to the apparent cheapness of capital expensed over many years. If the cost of a long-lived asset – one that will deliver its services over, say, 30 years – shows in the budget as one-thirtieth of its up-front cost, the argument goes, councillors will buy more of it. (Robson & Omran, 2019, p. 16)
Showing elected officials eye-wateringly large numbers in the budget may indeed be an effective means of reigning in their propensity to spend. However, making elected officials think twice is not the only reason to show the full capital expenditure (and offsetting sources of funding) in the budget. Capital projects are more complex than simple netted-out equivalent annual costs. First, the full present value of the expenditure is an important signal of strategic intent. It tells much about each service’s priority in the government’s overall plans. For example, very large capital projects in a relatively low-priority services suggest a mismatch between stated priorities and actual priorities. Accrual accounting could, in principle, help elected officials hide “vanity projects” from casual readers of the budget. Conversely, strategically important services generally require significant capital investments at regular intervals. The absence of large periodic spikes in capital spending may signal a lack of adequate asset replacement.
Visibility into the sources of funding for capital projects is also important. Local governments typically fund capital projects in three ways: reserves, debt, and—if they are lucky—grants from other levels of government or other sources[1]. Reserves are merely cashflows from previous time periods stashed away as retained earnings. Debt is the temporal opposite of reserves: expenses in the current time period are paid for using cashflows delayed into the future (at a cost, of course). Grants are new money, rather than cashflows moved forward or backward in time. However, all grants entail an opportunity cost. This is obvious for unrestricted grants (grants with no or few conditions on their use): grant money applied to Project A cannot be applied to Project B. However, even restricted grants (those tied to a specific project) entail a decision about which grants to prioritize and chase in the first place. In short, all three sources of capital funding—reserves, debt, and grants—involve opportunity costs and therefore also reveal important information about the local government’s strategic intent. Amortizing expenses and sources of funding satisfies the underlying logic of accrual but obscures this important signal. Other distortions may also arise. For example, the senior government’s donor sign will say it contributed $X million to the project but this grant amount will not show in the budget. Instead, it will appear as a trickle of much smaller payments over the useful life of the project.
So, how can readers of the budget have it both ways: combine the non-distorting, steady-state perspective of accrual accounting with the informational value of seeing the full cash impact of large capital projects? Three things are required to achieve this:
- Interactive visual presentations of financial information that establish clear distinctions between steady-state cashflows and transient froth (discussed in the previous section)
- Policies that translate the non-cash concept of deprecation into real cashflows
- Accounting policies that allocate all cashflows to cost centers instead of tracking them in centralized pools
The second of these is critical. Depreciation (sometimes called “amortization” in local government) is a non-cash expense. It thus appears in the financial statements but not in the cash budget. The logic is that an asset like a fire truck may be worth $20,000 less at the end of the year due to wear and tear, but the loss of value is reflected in the reduced balance sheet value of the asset, not as an identifiable cash expense. This creates the illusion in the budget that asset depreciation is costless:
Ignoring amortization encourages undercharging for ongoing services, such as water or roads, and means budgets do not show councillors the cumulating depreciation that signals that an asset is approaching the end of its useful life. (Robson & Omran, 2019, p. 17)
An approach adopted by some local governments is to use transfers into reserves to create a cash equivalent of non-cash depreciation. For example, the local government can put aside $20,000 in a replacement reserve each year to approximately offset the annual loss in value of its fire truck. This practice has two advantages: First, the reserve provides an important source of funding for the truck’s replacement. This is especially critical if the local government’s asset management plan runs hard against borrowing constraints. Of course, if there is no statutory requirement that the reserve be used exclusively for its stated purpose, replacement reserves are merely “mental accounting”. But in the same way that a jar labeled “vacation fund” is a useful psychological tool for managing household expenses, funding expensive assets from named reserves tends to make replacement decisions much easier for elected officials.
The second advantage of reserve contributions that they provide visible signals of the true lifecycle costs of assets. Combined with debt payments, reserve contributions create something close to an accrual view of the capital project. And unlike the abstract version of depreciation included in the financial statements, these cash expenses appear naturally in the budget. To illustrate, consider the following entries in a stylized cash budget:
|
Revenues: |
|
|
|
Transfers in from reserves (transient) |
|
|
Debt proceeds (transient) |
|
|
Grants (transient) |
|
Expenses: |
|
|
|
Costs of the capital project (transient) |
|
|
Principal repayment (steady-state over the borrowing term) |
|
|
Interest payments (steady state over the borrowing term) |
|
|
Transfers to replacement reserve (steady state over the useful life the project) |
The inclusion of all capital costs and funding sources in the budget creates visibility into strategic priorities and intent. However, since the transient cashflows net to zero (if not in the current year, at least eventually), they do not distort the effective annual cost to taxpayers of the service, which is captured by the steady-state expenses: principal, interest, and replacement reserve contributions.
One barrier to balancing capital costs and revenues in practice is centralized pooling of reserve transactions, debt proceeds, and grants within the local government’s accounting system. For example, some local governments assign debt proceeds to “general government” or a special finance cost center. Unfortunately, these internal cost centers have no external significance—they do not correspond to identifiable government services, like roads, fire protection, or economic development. Balancing the capital costs within each cost center with sources of funding thus often requires “unscrambling the egg”—augmenting the existing chart of accounts with information about the benefiting cost center. Getting a complete view of each cost center is much easier when all cashflows—including sources of funding for capital projects—are allocated to the appropriate cost center from the outset.
An example of where this allocation approach works well is in regional districts in British Columbia. The services provided by regional districts tend not to be uniform, especially in remote areas. For example, some rural properties might receive curbside garbage pickup while others do not. Regional districts are therefore mandated to clearly define the properties that participate in, and keep a segregated and balanced budget for, each of their services. The proscription against transferring money from one service to another ensures that cash flows—operating and capital—are allocated directly to their actual uses rather than pooled centrally.
To illustrate, consider the budgeted revenues and expenses for a small rural fire service within a regional district shown in Figure 2. As in the previous graphics, a visual distinction is made between transient cashflows and steady-state (effectively non-discretionary) cashflows. The graph on the right shows that capital expenditure dominates the 2018 budget for this service. However, the graph on the left shows the offsetting revenues (in this case, debt, capital reserves, and a very small grant). The effective annual cost of capital projects is captured by the much smaller debt servicing costs (“Principal repayment” and “Interest and financial charges”) plus transfers to reserves (which is denoted “non-steady-state” because such reserve contributions are not mandatory). Readers of the graphics can tell at a glance that the main in-year cost drivers for roads are employee-related despite the large spike in capital spending.
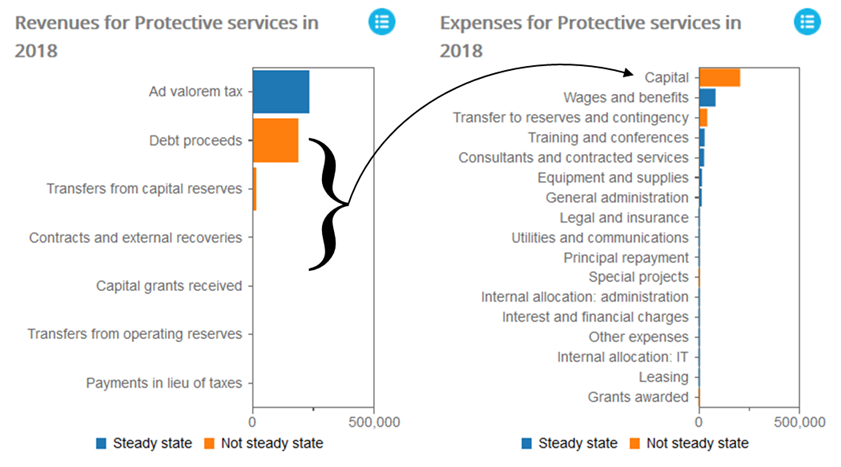
Figure 2: Combined operating and capital budget in which sources of capital funding offset capital expenditure.
The Whole Taxpayer Perspective
PSAS also mandate that financial statements be comprehensive, capturing the full range of activities under the control of the reporting entity. Some municipal budgets define the boundary more narrowly, and in some cases separate tax-supported from fee-supported services, with the latter potentially netted out. Whatever the value of presenting these two types of services separately – there is a case for highlighting items that residents will pay for regardless of use, as opposed to those over which they have some control – defining the city’s activities too narrowly and netting present a misleadingly small fiscal footprint. (Robson & Omran, 2019, p. 5)
Fees are an important part of a local government’s “claim on its citizens’ resources.” (Robson & Omran, 2019, p. 1) On average, 39% of the tax + fee total raised by communities in British Columbia comes from fees (Brydon, 2019). Some of these communities (9%) raise more money in fees than they do in taxes. Yet, discussions of local government budgets in the media and elsewhere focus almost exclusively on property tax increases, mill rates, and other property tax-centric measures. The result is that services typically funded by fees—such as water utilities, sewer systems, and landfills—are largely ignored at budget time even though they are the most economically important services in many communities.
The approach favored by Robson and Omran is to focus on a more comprehensive measure of taxpayer impact: the total amount in taxes of all types, fees, penalties, and fines paid by taxpayers to fund municipal services. This allows each service to be ranked in terms of its taxpayer “footprint”. For example, the pie chart on the left of Figure 3 shows the relative importance of each service segment according to taxpayer footprint (or “taxpayer cost”) for a BC municipality. As the highlighted slice shows, the taxpayer impact of utilities in this community is higher than that of other local government services combined.
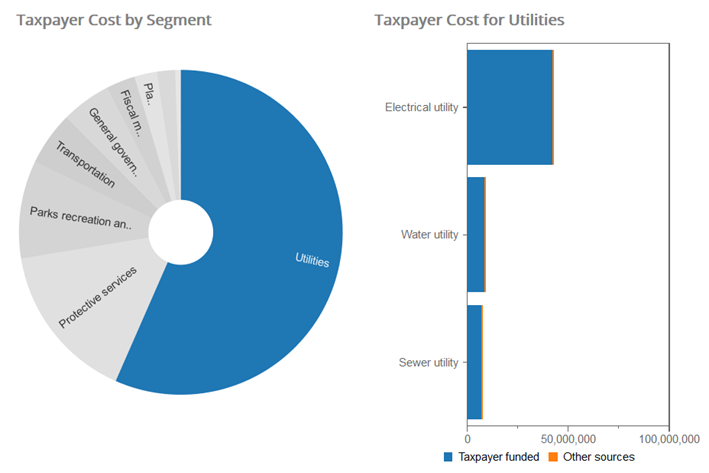
Figure 3: The pie chart on the left shows local government services ranked by total taxpayer impact. The bar chart on the right provides finer-grained detail on the highlighted pie wedge (in this case, the "Utilities" segment).
Drilling down further into the electrical utility in Figure 4 confirms that “fees and sales” is the dominant source of funding for the service. We can then “pivot” the municipality’s data to show all sources of revenue across all cost centers, as show in Figure 5. Not only does the total amount of fees and sales collected by the municipality dwarf ad valorem taxation, the fees and sales for the electrical utility alone (~$42M) are larger than all tax revenue (~$34M).
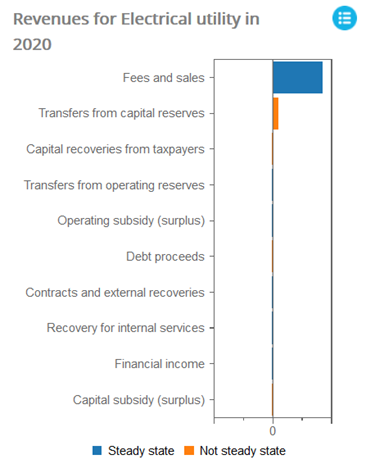
Figure 4: Drill down on revenues for electrical utility. Fees and sales are the dominant source of funding for the utility.
This municipality clearly provides an extreme case due to its ownership of a large electrical utility—the organization is effectively a utility company with a sideline in local government. Even so, we should expect the amount of managerial attention within the government, and stakeholder scrutiny outside of it, to be roughly proportional to the taxpayer footprint of each service. However, the traditional focus on tax rates means that the largest slices of the pie are often forgotten.
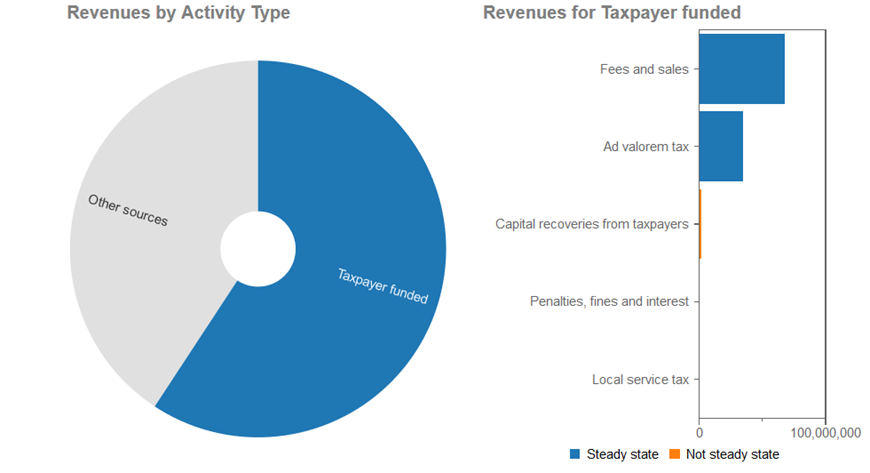
Figure 5: Revenues across all cost centers. The bar chart on the right show the importance of fees and sales relative to other forms of taxpayer-funded revenue in the municipality.
The Importance of the Chart of Accounts
Accounting information in local governments serves many purposes. Of these, preparation of financial statements is often the highest priority within the accounting function due to the legislated requirement to satisfy external auditors. Budget preparation is generally second in priority due to tight timelines and the public visibility of budget decisions. However, as Robson and Omran point out, financial statements and budgets have different audiences and data requirements. Unfortunately, a practice that makes the preparation of financial statements simpler—such as pooling grants, debt proceeds, and other revenues in central, finance-based cost centers—makes the creation of combined operating and capital budgets more difficult.
The ideal remedy is to develop a chart of accounts that is flexible enough to support both financial reporting and budgeting. For example, clear distinctions should be made between capital reserves and operating reserves for each cost center so that contributions from capital reserves can be seen to offset capital expenditures. However, any increase in the granularity (and thus number) of accounts typically results in an increase in data entry errors. And modifying a chart of accounts is a complex and difficult process that seldom rises in priority above the more pressing concerns of audit and budget preparation. One potential remedy, which some local governments have adopted, is to use third-party tools outside the core accounting system to map individual accounts according to specific purposes, such as financial statements, budgets, and public presentations. In the most risk-prone and labor-intensive cases, this mapping is done using Microsoft Excel. A more advanced approach is to use databases and automated mapping scripts based on account codes or, if need be, account names. Naturally, the benefits of the automated approach are limited if the chart of accounts lacks sufficient regularity in account numbering and naming.
Conclusion
Robson and Omran identify several important problems with local government budgets as part of their report card on Canadian municipal financial disclosure. The underlying dilemma revolves around the best way to present the financial impacts of long-lived assets in a manner that encourages rational decision making by local governments and provides a realistic basis for oversight by taxpayers and other stakeholders. Robson and Omran recommend local governments adopt accrual-based budgets (or supplements) in order to accurately represent the lifecycle costs of assets and provide better comparability with financial statements. However, accrual-based budgets create their own distortions and pose significant barriers to understanding for both casual readers and decision makers.
The purpose of this paper is to propose an alternative to both traditional cash-based budgets and accrual-based budgets that combines technology with straightforward policy recommendations for funding and accounting for capital projects. The proposal has three specific components:
- Interactive visual presentation of financial information
- Replacement reserve contributions that reflect the non-cash cost of depreciation
- Allocation of all capital cashflows to cost centers that correspond to identifiable local government services.
The first of these components is a technology. It replaces outdated static (paper or equivalent), table-based presentations of financial information with interactive graphical tools that allow readers to exploit their powerful visual pattern recognition capability to spot outliers, patterns, and trends. The second is a policy choice regarding reserves. Many local governments in Canada face significant infrastructure funding gaps due to their historical unwillingness to fund adequate replacement reserves. Reserve contributions are, after all, cash expenses that have an immediate effect on tax requisitions and fees. Realistic asset management plans that include adequate annual reserve contributions not only help close the infrastructure funding gap but help achieve the key benefit of accrual accounting: providing decision makers with an accurate view of the lifecycle costs of assets. The third component of the approach proposed here involves low-level but important change to accounting practices. Many local governments recognize the advantages of going beyond the rudimentary presentation capabilities of their core accounting system. Fortunately, many third-party solutions exist to supplement core system without impacting existing accounting and reporting workflows. However, core analytic operations, such as pivoting and drilling down presuppose fine-grained, high-quality data. A chart of accounts that is too coarse-grained or inconsistently applied can create an insurmountable barrier to the interactive visual presentation of financial information.
References
Brydon, M., 2019, “Tax versus Fess as a Revenue Source for British Columbia Municipalities”, https://public.tableau.com/profile/michael.brydon#!/vizhome/FeesAndTaxes/TaxVsFees
Carraher, S. & Van Auken, H., 2013, “The use of financial statements for decision making by small firms”, Journal of Small Business & Entrepreneurship, 26:3, 323-336.
Eulner, V. & Waldbauer, G., 2018, “New development: Cash versus accrual accounting for the public sector—EPSAS”, Public Money & Management, https://doi-org.proxy.lib.sfu.ca/10.1080/09540962.2018.1444560.
Robson, W. & Omran, F., 2019, “From A to F: Grading the Fiscal Transparency of Canada’s Cities, 2019,” C.D. Howe Institute, https://www.cdhowe.org/public-policy-research/f-grading-fiscal-transparency-canada%E2%80%99s-cities-2019.
[1] Infrastructure to service growth may be funded in part by development cost charges (DCCs). DCCs are fees paid by developers at the time of new development and are thus a form of immediate cost recovery for the infrastructure than enables growth. When DCCs do arise, they resemble grants in that they are new revenues into the local government.